- Home
- Context
-
Management Report
- The Operating Environment...and Trends Refining Our Portfolio...and Reinventing Our Future Financial Value Creation Delivering Value to Customers...and their Value to Us Working at Dimo...Enjoyable and Rewarding Our Business Partners...A Symbiotic Relationship Regulatory Authorities...Playing by the Rules Our Community...Live and Let Live The Environment...Now and for Generations Yet Unborn Sustainability Performance Objectives in 2012/13
- Stewardship
-
Financial Reports
- Annual Report of the Board of Directors Statement of Directors' Responsibilities for the Financial Statements Independent Auditors' Report Income Statement and Statement of Comprehensive Income Statement of Financial Position Statement of Changes in Equity Cash Flow Statement Notes to the Financial Statements
- Appendices
- Downloads
- Management of financial capital and
- Review of financial performance
- Financial investment in capacity building in order to drive growth.
- Striking a balance between growth and immediate profitability in allocating financial resources.
- Optimising profitability through efficient utilisation of resources particularly through prudent working capital management.
- Maintaining a healthy Balance Sheet.
Produced by Smart Media
The Annual Report Company
The Annual Report Company
Financial Value Creation
| Key Performance Area | Metric | 2012/13 | 2011/12 | 2010/11 | 2009/10 |
| Profitability | Sales (Rs. mn) | 27,711 | 39,863 | 29,357 | 10,530 |
| Gross profit ratio (%) | 15.21 | 18.23 | 20.30 | 22.70 | |
| Net profit ratio (%) | 1.70 | 6.81 | 7.20 | 2.40 | |
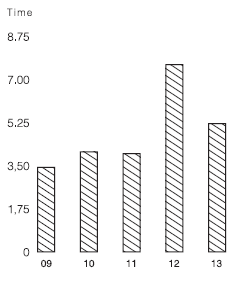
| Working capital management | Current ratio (times)-at the year end | 1.71 | 1.60 | 1.27 | 1.28 |
| Quick Assets Ratio (times)-at the year end | 0.72 | 0.36 | 0.84 | 0.78 | |
| Fixed Assets Turnover (times) | 4.98 | 8.55 | 9.59 | 4.92 | |
| Asset Utilization | Capital expenditure as percentage of total assets (%) | 8.50 | 6.20 | 9.90 | 7.00 |
| Capital structure | Debt/Equity (%) - at year end | 10.10 | 13.40 | 9.80 | 30.20 |
| Interest cover (times) | 2.24 | 15.67 | 17.35 | 2.12 |
A Forward Looking Note
We are focused on improving profitability through gross profit margin, greater efficiencies, higher value addition and productivity improvements. We will continue to diversify the revenue sources and reduce high dependence on the motor segment. Overall, the budgets for 2013/14 projects a significantly improved performance compared to 2012/13.
Guiding Philosophy
Dimo perceives that financial value creation is the mechanism that converts financial and non-financial inputs to certain outputs that are measured as financial performance. The corporate philosophy strongly subscribes to the view that financial performance is largely dependent on quality, availability and effective management of the ‘capitals’. Therefore, financial performance is considered to be the ‘barometer’ of efficiency in managing the capitals. Financial results and financial position reflect the financial performance of the Company.
This review of financial value creation encompasses two aspects. They are;
Whilst the former attempts to focus on managing financial capital as an input, the latter focuses on the output generated through the interaction of all forms of capitals.
Management of Financial Capital
This entails the entire gamut of activities involved in the process of obtaining, allocating and using ‘finance’ effectively and efficiently so as to achieve the organisation’s objectives.
Economic environment has a bearing on the way financial capital is so managed. Hence, this has to be read in the context of the economic environment detailed in ‘The Operating Environment’.
Capital Expenditure
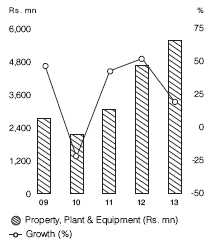
The Company continued with the planned investments to expand capacity. An amount of Rs. 1,094.4 mn. (Rs. 947.4 mn in 2011/12) was invested in property, plant & equipment (PP&E) during the year. Of this, Rs. 443.9 mn was spent on the construction of the Mercedes Centre, the single largest investment planned. Other items include acquisition of a workshop on a 147 perch block of land in Moratuwa for Tata Passenger Vehicles, refurbishing of the Moratuwa workshop and construction of the Jaffna workshop.
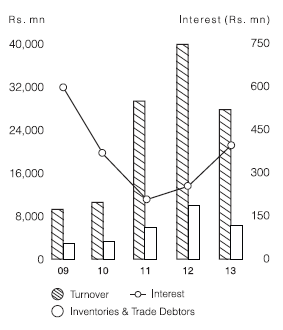
Working Capital
The working capital requirement substantially reduced as a result of reduced sales of vehicles, tractors and construction machinery. Value of the inventory and the number of units in stock saw significant reductions. However, receivables as at the year-end rose to Rs. 2,086 mn compared to Rs. 1,809 mn as at the beginning of the year.
Financing
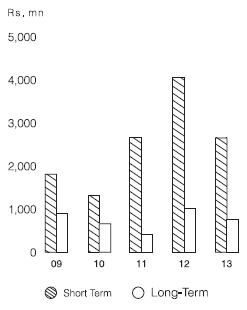
Long-term debt was sought mainly to finance investments in PP&E. The outstanding balance as at 31st March 2013 was Rs. 770.2 mn (2011/12 - Rs. 1,000.1 mn), details of which are given in Note 29 to the Financial Statements. Short-term loans were obtained to finance working capital. The outstanding balance as at 31st March 2013 was Rs. 2,647.5 mn (2011/12 - Rs. 4,045.6 mn). Consequently, a total of Rs. 3,417.8 mn (2011/12 - Rs. 5,045.8 mn) was outstanding on account of short and long-term borrowings as at 31st March 2013. Interest rates on overdrafts are reviewed periodically while rates charged on short term/import loans are determined based on market rates.
Treasury Management
The Group operates a central treasury function. It controls decisions in respect of cash management, utilisation of borrowing facilities, banking relationships, interest rate risk and foreign currency exposure management. Further, it facilitates effective cross utilisation of funds between business units.
Cash Flow
Funds generated from operating activities increased to Rs. 4,111.3 mn (Cash out flow of Rs. 55.6 mn - 2011/12) despite a significantly lower operating profit. This was possible due to the reduction in working capital requirements consequent to a reduction in inventory. This helped the Company to generate a net increase in cash and cash equivalents of Rs. 1,763.1 mn (a net decrease of Rs. 2,941 mn - 2011/12) after cash outflows on investing and financing activities. Improvement in funds generated from operating activities enabled the Company to have a positive free cash flow (defined as cash flow from operating activities less capital expenditure) of Rs. 3,016.9 as against a negative free cash flow of Rs. 1,002.9 in 2011/12.
Financial Priorities
Plans to enhance workshop capacity and the dip in profitability have given rise to the need to raise funds at competitive costs to support investment plans, prudent management of costs and efficient management of working capital.
These concerns are integrated with the identified long-term financial priorities that are strongly pursued in formulating corporate strategy. Given below are the financial priorities that drive the Group’s financial strategy:
Financial Performance
Overview
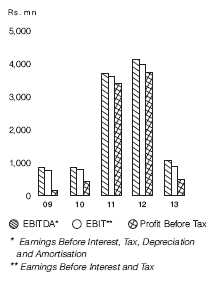
The overall performance during the year was below expectations. The profit before tax reduced by 87 % to Rs. 490 mn from Rs. 3,724.5 mn in 2011/12. Lower turnover and gross profit margins were two key factors that affected the profit before tax. Increase in administrative expenses and net finance cost too created an adverse impact on profits.
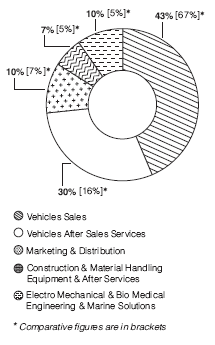
As a result of the turnover of the vehicles, construction & material handling equipment, commercial vehicles and passenger vehicles segments dropping, Group turnover reduced by 30% to Rs. 27.7 bn from Rs.39.9 bn the previous year. The reduction in vehicles segment turnover is mainly attributed to the reduction in the market size or the number of vehicles imported into the country. The statistics pertaining to vehicle imports are given on page 19. The demand for the construction machinery did not correspond to the growth in the construction sector. On the other hand, turnover of vehicles after-sales segment & electro-mechanical, biomedical engineering and marine solutions segment increased by 31.6% and 34.2% respectively.
Profitability
The gross profit margin reduced from 18.2% to 15.2%. This is primarily attributed to the lower margins in the vehicle related businesses. The vehicle permit regime under which a large number of passenger vehicles were imported on concessionary tariff and the lower demand for vehicles created pressure on gross profit margins.
On the other hand, administration expenses and distribution expenses taken together increased by 4%. The reduction in the distribution expenses is due to the decrease in the provision for impairment of receivables as a result of the change in the provisioning policy in order to be in line with adoption of LKAS 39. The impact due to the change in policy is given in Note 38 to the Financial Statements.
In the backdrop of increased borrowing rates, a higher level of borrowings during the first half of the year, the net finance cost increased to Rs. 395.5 mn from Rs. 253.9 mn in the previous year.

Taxation
The rate of income tax applicable to the Company and subsidiaries was 28%, whilst the rate of income tax applicable for exports was a concessionary rate of 12%. The qualifying payment arising under Section 34 (C) of the Inland Revenue Act No. 10 of 2006 and amendments thereto, on account of the investment in the Mercedes Benz Centre enabled the Group to lower its tax charge for the year. Details of income tax charge for the year are available in Note 12 to the Financial Statements. The tax expense includes a tax reversal of Rs. 42.7 mn on account of deferred tax (Rs. 29.8 mn in the last financial year). A summarised computation of deferred tax is given in Note 28 to the Financial Statements.
Earnings
Earnings before interest and tax (EBIT) for the year reduced to Rs. 885.5 mn from Rs. 3,978.4 mn the previous year while net profit after tax reduced to Rs. 462 mn from Rs. 2,701.7 mn. Following suit, earnings per share (EPS) reduced to Rs. 52.06 from Rs. 304.36. The computation of EPS is given in Note 13 to the Financial Statements.
Stakeholder Financial Implications
As shown in the Statement of Value Added below, the Group generated a value addition of Rs. 5,794 mn during the year as against Rs. 10,932 mn in 2011/12 which was shared with the various stakeholders and a portion was retained within the Company. Reflecting lower earnings, Economic Value Added (EVA) too turned negative for the year. However, it is noteworthy that the EVA for the financial years 2011/12 and 2010/11 was a positive Rs. 1,904 mn and Rs. 1,762 mn respectively.
Statement of Value Added and Distributed
| Group | Company | |||||||
| For the period of | 2012/13 | 2011/12 | 2012/13 | 2011/12 | ||||
| % | Rs. ’000 | % | Rs. ’000 | % | Rs. ’000 | % | Rs. ’000 | |
| Gross turnover | 27,711,604 | 39,862,943 | 26,496,949 | 38,877,422 | ||||
| Other income | 40,321 | 49,846 | 38,305 | 43,968 | ||||
| Less: Cost of materials and services bought in | (21,957,333) | (28,980,946) | (21,111,205) | (28,355,619) | ||||
| 5,794,592 | 10,931,843 | 5,424,049 | 10,565,771 | |||||
| Distribution of Value Added | ||||||||
| Employees | 29 | 1,657,099 | 13 | 1,372,494 | 27 | 1,480,637 | 11 | 1,211,045 |
| Government | 51 | 2,971,592 | 55 | 6,062,532 | 54 | 2,901,017 | 57 | 5,977,377 |
| Lenders | 07 | 395,480 | 02 | 253,890 | 07 | 389,620 | 03 | 267,900 |
| Community investment | 00 | 52,122 | 00 | 51,055 | 00 | 51,522 | 00 | 50,526 |
| Shareholders | 02 | 88,764 | 03 | 355,057 | 02 | 88,764 | 03 | 355,057 |
| Retained in the business | 11 | 629,535 | 26 | 2,836,815 | 09 | 512,489 | 26 | 2,703,866 |
| Depreciation set aside | 03 | 167,385 | 01 | 135,164 | 03 | 160,665 | 01 | 129,965 |
| Profit retained | 08 | 462,150 | 25 | 2,701,651 | 06 | 351,824 | 24 | 2,573,901 |
| 100 | 5,794,592 | 100 | 10,931,843 | 100 | 5,424,049 | 100 | 10,565,771 | |
Shareholders
Total shareholder return (TSR) computed taking into account the movement in share price at the beginning and end of the year and the dividends declared turned a negative 47.5% due to the drop in the share price and the lower dividend. Value of a Rs. 1,000/- invested in 2004 appreciated to Rs. 11,879/- as at current year end although it is one third of the value as at 31st March 2011 when it reached a peak of Rs. 34,238/-. Reflecting lower earnings, return on assets too came down to 6.6% from 19.3% last year.
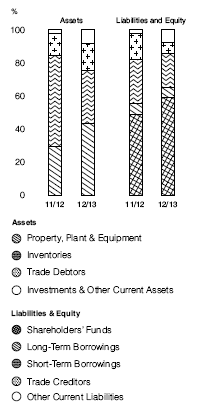
Financial Position
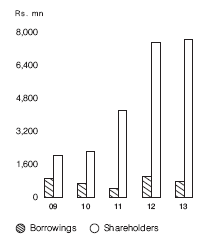
Primarily due to the drastic drop in inventory, the total assets contracted from Rs. 15.3 bn a year ago to Rs. 12.9 bn as at 31st March 2013. However, with Rs. 7,631.1 mn in equity and borrowings at Rs. 770.2 mn, Dimo had a debt to equity ratio of 0.10 : 1 signifying a strong financial position with a relatively low level of gearing. Lower business volumes and the resulting drop in the working capital requirement improved liquidity. The current ratio as at 31st March 2013 was 1.71 : 1 (2011/12 - 1.60 : 1) while the quick assets ratio was 0.72 : 1 (2011/12 - 0.36 : 1).
Solvency
As required by Section 56 of the Companies Act No. 07 of 2007, the Company carried out solvency tests prior to the payment of the final dividend. The Company Auditors certified that the Company has the ability to pay its debts as they become due in the normal course of business and that the value of the Company’s assets is greater than the value of its liabilities and the Company’s stated capital.
Following is the computation of solvency for the company as at the year end.
| As at 31st March | 2012/13 |
2011/12 |
| (Rs. mn) | (Rs. mn) | |
| Non-current assets | 5,719.0 | 4,763.4 |
| Current assets | 7,181.4 | 10,536.7 |
| Total assets | 12,900.4 | 15,300.2 |
| Current liabilities | 4,204.8 | 6,593.9 |
| Non current liabilities | 1,064.3 | 1,265.6 |
| Total liabilities | 5,269.2 | 7,859.6 |
| Assets less liabilities | 7,631.1 | 7,440.6 |
| Stated capital | 425.3 | 425.3 |
| Capital reserve | 2,014.7 | 2,014.7 |
| Revenue reserve | 5,191.1 | 5,000.6 |
| Total equity | 7,631.1 | 7,440.6 |
Financial Outlook 2013/14
Removal of regulatory restrictions on credit growth of commercial banks with effect from 1st January 2013 is expected to increase the supply of credit encouraging investment. Permission given to the private sector to secure borrowings from foreign sources, albeit with limitations, is expected to further facilitate investment. Dimo, being a company that is involved in supplying capital goods would stand to gain in a scenario of expanding investments. Expansion of credit supply also brings the possibility of lower rates of interest that could lower financing costs. Overall, the budgets prepared for the financial year 2013/14 projects a significantly improved performance compared to the year 2012/13.
What follows is an account of our ‘non-financial’ enterprise, the social and environmental dimensions of our business.