- Home
- Context
-
Management Report
- The Operating Environment...and Trends Refining Our Portfolio...and Reinventing Our Future Financial Value Creation Delivering Value to Customers...and their Value to Us Working at Dimo...Enjoyable and Rewarding Our Business Partners...A Symbiotic Relationship Regulatory Authorities...Playing by the Rules Our Community...Live and Let Live The Environment...Now and for Generations Yet Unborn Sustainability Performance Objectives in 2012/13
- Stewardship
-
Financial Reports
- Annual Report of the Board of Directors Statement of Directors' Responsibilities for the Financial Statements Independent Auditors' Report Income Statement and Statement of Comprehensive Income Statement of Financial Position Statement of Changes in Equity Cash Flow Statement Notes to the Financial Statements
- Appendices
- Downloads
- Management of atmospheric emissions and climate change
- Energy and fuel management
- Water management
- Waste management
- Materials management
- Noise management
- Green Team 1 – Tasked with flood prevention - Required to prevent flooding by ensuring that drainage systems are in place and are regularly maintained.
- Green Team 2 – Tasked with Electricity Conservation – Required to identify electricity consumption of all key locations and eliminate waste/unproductive use.
- Green Team 3 – Tasked with Waste Management – Required to minimise land contamination due to garbage generated by the Group.
- Green Team 4 – Tasked with Water Conservation – Required to minimise water wastage as a result of unproductive consumption by processes and employees.
- 80% less potable water usage
- 55% of the building material can be reused
- 30-40% use of recyclable materials for construction
- 22% less energy usage without solar photovoltaic
- Skylights and louvers used for better lighting conditions
- Cement paving blocks used for reduced heat-island effect
- Use of innovative lighting technology
- Rain water harvesting
- Use of optimum natural ventilation
- Sustainable policy on recycling of materials
- Well controlled storm water discharge during construction
- Particulate matters generated during construction were eliminated from their sources
- Strict control on materials containing volatile organic compounds
- Emphasis on contributing to control of urban flash floods by using innovative hydrology techniques and storm water management techniques
- Car park allocation for Low Emitting and Fuel Efficient Vehicles”
- Encouraged use of bicycles to reduce emissions
- Use of water efficient fixtures
- Use of construction materials free of Urea Formaldehyde
- Better user oriented lighting control system
- Maintenance of strict no-smoking zone
- Sustainable sites
- Water Efficiency
- Energy & Atmosphere
- Materials & Resources
- Indoor Environmental quality
- Innovation and design
- Our buy-back scheme for tyres has allowed us to re-build 1312(1,449 in 2012/13) tyres in the year in review.
- 450 (843 in the previous year) used tyres were also handed over to a third party manufacturer for use as input raw material.
- Printer cartridges/toners are sent to third parties for recycling purposes. During the year 224 units were recycled.
- Used computers, equipment, accessories and consumables are handed over to third parties for recycling.
Items 2012/13 2011/12 2010/11 Disposal CPUs/UPS& ups Batteries 64 22 3 Handed over to authorised third party for recycling/reuse Laptops 9 7 1 Monitors 13 18 5 Printers 12 14 1 Servers 6 2 - Toners/Cartridge 224 97 202
Produced by Smart Media
The Annual Report Company
The Annual Report Company
The Environment…Now and for Generations Yet Unborn
| Key Performance Area | Metric | 2012/13 | 2011/12 | 2010/11 | 2009/10 |
| Combating climate change | Carbon footprint tCO2 e per Rs. 1 mn of Gr oup net turnover | 0.2292 | 0.1674 | 0.1064 | 0.2472 |
| Total energy consumption (1,000 GJ) | 60,547 | 78,184 | 32,264 | 26,210 | |
| Energy consumption (Giga joules) per employee (on average) | 42 | 58 | 31 | 30 | |
| Total water consumption (m3) | 101,984 | 75,640 | 46,408 | 37,572 | |
| Ground water recycled and reused as a percentage of total water consumption (%) | 21.00 | 15.00 | 24.00 | 34.00 | |
| Total hazardous waste sent for recycling/reusing | |||||
| Kg | 132,364 | 65,989 | 37,002 | N/A | |
| Litres | 105,506 | 94,267 | 80,295 | N/A | |
| Nos. | 37,065 | 22,091 | 24,379 | N/A |
A Forward Looking Note
We are intent on reducing our greenhouse gas emissions by 5% and improving our water reuse percentage by 1% per annum.
Guiding Philosophy
The inescapable fact which we must all accept is that business impacts the environment. Being resolute of will, we have resolved to go the extra mile to manage this very important factor of our enterprise. Dimo has put in place an environmental management system accredited with ISO 14001certification. Our Sustainability Committee, with appropriate representations within the Company, provides the forum to discuss matters relating to environmental sustainability.
In order to manage the environmental impact effectively, the Company focuses on six strategic areas as depicted in the following diagram.
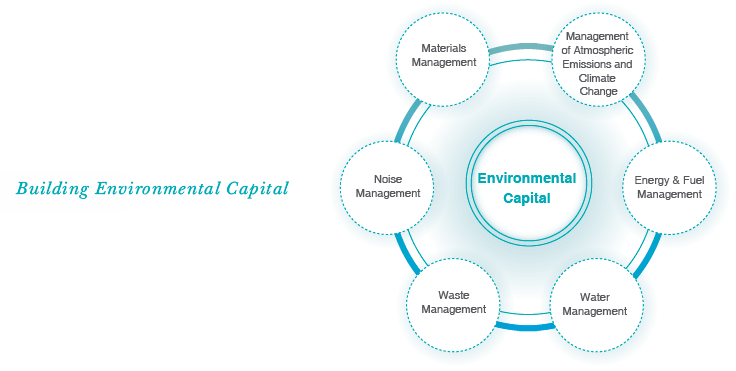
In steering the enactment of our Environmental Management Strategies across the Company, the Group Management Committee and the Sustainability Committee ensure that Group guidelines are adhered to and practiced. In addition, senior management staff has specific responsibility for managing environmental as well as occupational health and safety issues related to their respective business units.
All related systems and processes undergo continuous review and are revised as deemed necessary.
Our Environmental Management System (EMS) enables us to measure the impact of our operations on the environment and facilitates timely mitigation wherever risk is indicated. The EMS is guided by the Triple R concept – Reduce, Reuse and Recycle. Our EMS has received ISO 14001:2004 accreditation.
As depicted in our diagram appearing above, Dimo has identified six strategic areas in respect of the management of environmental issues –
Action is implemented across these areas through our business units as well as through the activities of specially formed ‘Go Green’ teams, made up of members from across the Dimo Group. The four teams are:
Complementing these efforts is the Dimo Nature Club – a voluntary initiative, open to all members of the Dimo Group and focused on protecting the environment. Two meetings were held during the period under review and several sub-committees were formed to spearhead initiatives to do with flood prevention, conservation of electricity, waste and water management.
The Company continues to employ independent, third party assessments to ascertain our stakeholder expectations of Dimo vis-a-vis environmental concerns. A summary of their findings and action initiated by management are included in this report.
Atmospheric Emissions and Climate Change
Carbon Footprint
The correlation between greenhouse gas emissions and climate change is irrefutable today. Steeped as our business in the auto trade, we constantly strive to manage such harmful emissions and by implication, our carbon footprint.
This is the fifth consecutive year in which we have calculated and reported on our carbon footprint. The table below gives details of how we’ve progressed over the past three financial years.
The methodology of measurement follows the WBCSD/WRI Greenhouse Gas Protocol’s Corporate Standard (Revised Edition). The organisational boundary comprises all entities of the Dimo Group, encompassing operations in all parts of the country. Reporting is primarily under Scopes 1 and 2 with some elements of the optional Scope 3, according to data availability.
| Emission | Units | 2012/13 | 2011/12 | 2010/11 | |||
| Consumption | Emission tCO2 e |
Consumption | Emission tCO2e |
Consumption | Emission tCO2e |
||
| Scope 1 | |||||||
| Diesel for generators | Litre | 13,788 | 36 | 3,389 | 9 | 8,19 | 22 |
| Diesel for vehicles | Litre | 458,784 | 1,213 | 471,923 | 1,247 | 447,996 | 1,196 |
| Petrol for vehicles | Litre | 440,875 | 1,165 | 378,114 | 872 | 243,992 | 568 |
| Diesel for vehicle delivery to customer and service processes | Litre | 643,525 | 1,701 | 1,030,789 | 2,724 | - | - |
| Petrol for vehicle delivery to customer and service processes | Litre | 27,653 | 73 | 40,298 | 93 | - | - |
| LPG | kg | 7,475 | 16 | 7,138 | 16 | 8,550 | 19 |
| Scope 2 | |||||||
| Purchased Electricity | kWh | 2,619,380 | 1,763 | 2,227,384 | 1,514 | 1,890,897 | 1,286 |
| Scope 3 | |||||||
| International travelling | km | 220 | 119 | 1,066,602 | 101 | ||
| Fuel utilised by outsourced party –Diesel | Litre | 99,159 | 262 | 62,889 | 167 | ||
| Fuel utilised by outsourced party –Diesel | Litre | 8,613 | 19.86 | 6,804 | 16 | ||
| Total | 6,468 | 6,779 | 3,192 | ||||
Note-Fuel consumption for vehicle delivery to customer location consider under scope - 1
We’d like to comment on the results contained in the chart above, which will help to place these results in some perspective.
Direct GHG emissions from diesel for vehicles, vehicle delivery and service processes amounted to 2,914 tCO2e (3,972 tCO2e in 2011/12), which comprised 47% (59% last year) of our total carbon footprint.
Due mainly to the reductions we have been able to effect in diesel fuel consumption for vehicle delivery and service processes, our overall carbon footprint reduced by 10%.
When compared against an activity level, our GHG emission during the year under review increased to 0.2218 tCO2e per Rs. 1 mn of Group net turnover, compared with 0.1674 tCO2e recorded last year. This increase may be attributed to a reduction in turnover of 30% in comparison with the previous year, as well as the 5% reduction in our carbon footprint.
We are committed to refine and expand our scope of reporting in the year ahead.
Our ultimate objective is to achieve maximum reduction of our carbon footprint.
The Company also made progress in regard to reducing emission in other areas of activity. For example, during the year in review, equivalent of GHG emissions were reduced through the recycling of 4,795 kg of paper (621 kg last year). In addition the Company was able to reduce emissions by approximately 143.6 tco2 due to modification in the method of waste disposal.
Managing Atmospheric Emissions
All company owned as well as rented vehicles are subjected to regular emission tests. In addition, company owned vehicles are required to comply with our own stringent emission regulations as well as those promulgated by national authorities, in compliance with the National Environment Act.
Dimo has installed exhaust gas and dust extractors in stipulated areas, which deal effectively with emissions typically emanating from engine testing and the cleaning of air filters and brake assemblies. Our paint booths incorporate filtration systems that prevent the release of toxic fumes and particles into the atmosphere.
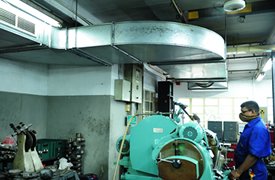
A fresh air validation system is in operation in our Engine Repair Facility, which monitors temperature, humidity and CO2 levels.
Dimo has increased its usage of facilities such as tele and video-conferencing in order to reduce air travel – the latter is known to be a significant contributor to GHG emission.
The Group’s activities do not seem to result in ozone depleting emissions. Even our use of CFC-free gases in vehicle and plant air conditioning has built in systems to capture and recycle gas when the units are serviced.
We monitor this area annually, to ensure compliance with tolerance levels stipulated by the Central Environmental Authority.
Dimo emission level Vs. Tolerance level imposed by environmental authority
| Emission type | SPM | SO2 | NO2 | CO2 | ||||||||
| Tolerance level | 0.35 (mg/m3) | 0.12 (mg/m3) | 0.15 (mg/m3) | 9(ppm) | ||||||||
| Location | 2012/13 | 2011/12 | 2010/11 | 2012/13 | 2011/12 | 2010/11 | 2012/13 | 2011/12 | 2010/11 | 2012/13 | 2011/12 | 2010/11 |
| Colombo -1 | 0.05 | 0.057 | 0.04 | 0.07 | 0.035 | 0.02 | 0.07 | 0.101 | 0.03 | 6.00 | 4.4 | 4.2 |
| Anuradhapura | 0.04 | 0.064 | 0.03 | 0.07 | 0.01 | 0.01 | 0.07 | 0.014 | 0.02 | 0.00 | 3.2 | 3.1 |
| Siyambalape | 0.03 | 0.036 | 0.03 | 0.02 | 0.047 | 0.02 | 0.01 | 0.054 | 0.03 | 3.00 | 4.6 | 2.8 |
| Colombo - 2 | 0.09 | 0.049 | 0.04 | 0.06 | 0.03 | 0.02 | 0.08 | 0.6 | 0.03 | 3.00 | 4.2 | 3.8 |
| Kurunegala | 0.02 | 0.058 | 0.03 | 0.02 | 0.019 | 0.01 | 0.02 | 0.018 | 0.02 | 3.00 | 3 | 2.5 |
| Matara | 0.03 | 0.055 | - | 0.02 | 0.013 | - | 0.03 | 0.023 | - | 3.00 | 2.6 | - |
| Waliweriya | 0.01 | 0.056 | - | 0.02 | 0.032 | - | 0.02 | 0.067 | - | 4.00 | 3 | - |
| Kandy | 0.04 | 0.07 | - | 0.02 | 0.043 | - | 0.02 | 0.035 | - | 2.00 | 3.2 | - |
| Ratnapura | 0.06 | 0.023 | - | 0.02 | 0.021 | - | 0.02 | 0.041 | - | 3.00 | 2.6 | - |
Climate change, whilst no doubt being a major global issue will not in the short-term pose significant risk or challenge to our business.
However, Sri Lanka being primarily reliant on hydro power generation could be adversely affected, should climate change significantly alter rainfall patterns and impact water resources in the country. Already, Sri Lanka is examining alternate sources of power and this could present opportunities to be tapped in renewable energy fields such as wind and solar power.
More directly, global realisation that fossil fuel resources are finite has spawned a flurry of interest and activity in exploring alternative fuels for automobiles. Our principals too are examining electronic and hybrid powering for their products and we eagerly look forward to introducing new lines of products to the local market in time to come.
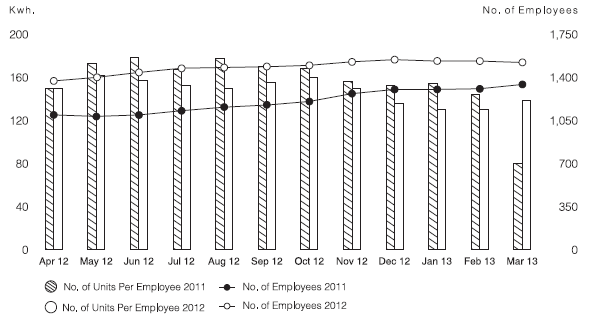
Energy and Fuel Management
Dimo’s main sources of energy are electricity, diesel, petrol and liquefied petroleum gas (LPG), the latter three mentioned being used mainly in company vehicles. The bulk of our electricity requirements are purchased from the National Grid whilst a relatively small amount is self generated via in-house generator plants. A small quantity of LPG is utilised in our staff cafeteria and workshops.
The chart below shows the Group’s energy consumption over the past three years.
| Units | Consumption | |||
| 2012/13 | 2011/12 | 2010/11 | ||
| Diesel for Vehicles* | GJ | 34,703 | 55,858 | 16,857 |
| Diesel for Generators* | GJ | 654 | 82 | 311 |
| Petrol for Vehicles* | GJ | 15,412 | 13,835 | 8,068 |
| LP Gas* | GJ | 349 | 328 | 221 |
| Electricity** | GJ | 9,429 | 8,081 | 6,807 |
| Total | 60,547 | 78,184 | 32,264 | |
* Direct Energy Consumption
** Indirect Energy Consumption
Energy consumption for the year under review reduced by 23%, consequent to the reduction in diesel fuel usage for customer deliveries by 37%. This fuel consumption has reduced as a consequence of a drop in sales volumes during 2012/13 whilst a procedure was in place to strictly monitor fuel consumed in respect of vehicle deliveries for the customer. Petrol consumption increased by 11% due to an increase in sales promotion activity.
Electricity consumption, however, increased by 5% due to several factors – the opening of 12 new sales locations, the expansion of our workshops at Balagolla, Anuradhapura, Siyambalape and the Bosch Diesel Centre as well as the extension of working hours at our workshops.
Energy Audit, Energy Efficiency and Conservation
As a company certified to conduct energy diagnosis and audit (accredited by Sri Lanka Sustainable Energy Authority ), Dimo conducts both in-house a well as external energy audits as an ongoing exercise.
The findings, in respect of internal energy audits serve to highlight areas where we can minimise waste and where we could improve energy efficiency. Measures highlighted and implemented include the use of capacitor banks for power factor correction, replacement of incandescent lighting with CFL and LED technology (almost all areas of the Group have been converted), programming all computers to revert to standby mode within a 5 minute idling period, setting air conditioning units at a constant minimum of 24o C or over and inculcating a culture amongst the staff of ‘switching it off’ – turning off lights, computers, taps – when not in use. New constructions make maximum use of natural lighting in their designs and adopt energy efficient building codes.
During the year under review, one energy audit for an external party was conducted and in implementing its findings, a saving of 52,032 kWh was achieved.
Through sales of electronic control equipment, a total energy saving of 314,475 kWh was achieved during the period in review.
Green Buildings
In expanding business across the country, all buildings housing our branches and service workshops tended to be of conventional design. These buildings met with the standards stipulated by local authorities and the Central Environment Authority (CEA).
These buildings met the standards of the day.
However, we realised that if we were to pursue sustainability of business more thoroughly, we would have to exceed even these standards.
Thus in 2009, Dimo decided to explore the Green Building concept – to upgrade our existing buildings and facilities to be more environmentally friendly and technologically current.
In tandem, we decided to seek LEED (Leadership in Energy and Environmental Design) certification in the Gold Category.
The Management opted to begin at the Bosch workshop at our Head Office. Construction work began in 2011 and in January 2012, the new Green Building Bosch workshop opened its doors to the customer.
The new facility earns its Green tag through the following attributes –
To obtain the LEED Certificate we had to go through a rating scheme.
The following areas were covered under the rating system
As per the ratings received we successfully obtained the LEED Certificate in the Gold category.
We consider this as one of our biggest contributions to the well-being of our environment and to future generations.
Due to the success of this project and the contribution we can make to the environment we have decided to utilise the Green Building concept to construct our new Mercedes Centre in our new location at Sirimavo Bandaranaike Mawatha, Colombo 14.
During the year the Company continued its awareness campaigns on energy saving across the Group by means of e-mail and sticker campaigns.
Energy Efficient Products
Energy efficiency is amply reflected in our product range too.
The Dimo Batta light truck and the TATA Nano car are amongst the most fuel efficient vehicles on the roads of Sri Lanka today. At the other end of the scale, our luxury Mercedes Benz range now incorporates Blue Efficiency Technology that has made them more fuel thrifty than ever.
Our lighting division markets the Osram range of LED and CFL energy saver bulbs and also offers its expertise, conducting energy audits for external parties.
Water Management
Dimo’s requirements of water are sourced mainly from the national supply. Ground water sources have also been tapped in certain locations – at Siyambalape Workshop, Weliweriya Logistics Centre and Colombo.
The Group uses water mainly for vehicle repairs and servicing and for domestic purposes as well.
Total Water Consumption & Reuse
| Description | Water usage(M3) | Reused water(M3) | Reused percentage (%) | ||||||
| 2012/13 | 2011/12 | 2010/11 | 2012/13 | 2011/12 | 2010/11 | 2012/13 | 2011/12 | 2010/11 | |
| Municipal Water | 55,508 | 42,329 | 28,479 | 1,729 | - | - | - | ||
| Ground water | 46,282 | 33,151 | 17,929 | 9,875 | 4,863 | 4,281 | 21 % | 15 % | 24 % |
| Rain Water Harvesting | 194 | 160 | - | ||||||
| Total | 101,984 | 75,640 | 46,408 | 11,604 | 4,863 | 4,281 | 11 % | 6% | 10 % |
A state-of-the-art water treatment/recycling plant is established at the Company’s all the workshop. The recycled water is used for the Company’s activities.
Water consumption has increased during the year under review due to following reasons.
During the previous financial year 25 locations drew their requirement of water from municipal supplies. For the year under review the number of such locations has increased to 35.
Vehicle throughput during the year has increased in all locations.
The number of employees increased this year.
Of the ground water consumed, 21% (15 % in FY 2011/12) has been recycled and reused. This amounts to 11% ((6% in FY 2011/12) of the total water consumption. The reduction in percentage of water recycled is due to the increase in number of vehicle repairs at Siyambalape. This resulted in a higher capacity in existing water treatment plant.
The total volume of water reused at Siyambalape and Weliveriya is 9,875 m³. Of this, 2,107m³ has been used for vehicle washing purposes whilst the balance has been used for gardening purposes in both premises.
Waste water management is discussed elsewhere in this report.
Waste Management
Reuse and recycle are our watchwords and approach in dealing with waste generated during our operations. Waste management and disposal across the Group is driven by our Go Green Team-3, well-supported by all our business units.
All waste is categorised into two main classes – hazardous and non-hazardous – and then further sub-divided according to the type of treatment they require for safe disposal.
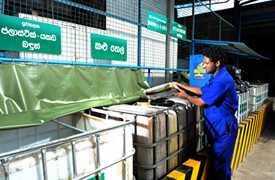
Waste Water Treatment
Dimo’s waste management processes prevent the discharge of untreated water into the sewage system. Waste water from all our workshops pass through oil separators and are monitored to ascertain their pH levels, to ensure compliance with legal limits.
The Company operates biological water treatment and recycling plants at TATA Commerical workshop/Construction Machinery Workshop at Siyambalape and Dimo Logistic Centre -Weliveriya. Water treatment plants are available at the Mercedes Benz passenger car workshop and TATA passenger car workshops at Colombo, Branches of TATA Commercial Workshop at Ratnapura, Anuradhapura, Matara, Kurunegala, Kandy and Trincomalee.
Most water recycled is used for industrial and not domestic purposes.
In addition, a random sample of recycled water is collected by an environmental authority approved third party to check whether its pH Value, Chemical Oxygen Demand (COD). Biochemical oxygen demand, Total Suspended solids and Oil/Grease content are below the tolerance level designated by the Environmental Authority. They have been found to be well below stipulated tolerance levels.
During the year water discharged through the treatment plants has been measured in Colombo, Siyambalape, Balagolla, Anuradhapura, Kandy, Kuruwita and Weliveriya.
| Location | Discharged volume (m³) |
| Colombo Passenger car workshop | 1,438 |
| Siyambalape Commercial vehicle workshop | 6,595 |
| Balagolla (Kandy service) | 1,382 |
| Anuradhapura (Commenced measuring in November) | 97 |
| Kuruwita | 291 |
| Weliveriya | 1,801 |
Water Withdrawal Against Consumption
| Withdrawal Source | Total Water Withdrawal | Type of Consumption | Amount of Withdrawal | Treated / Recycled and Discharged |
| Ground Water | 46,282 | Domestic | 29,757 | |
| Industrial | 16,525 | 9,875 | ||
| Municipal Water | 55,508 | Domestic | 48,678 | - |
| Industrial | 6,830 | 1,729 | ||
| Rain Water Harvesting | 194 | Domestic | - | - |
| Industrial | 194 | - | ||
| Total | 101,984 | 101,984 | 11,604 |
Non-Hazardous Solid Waste Management
Dimo operates a system of segregation for non-hazardous solid waste separating it according to organic material, paper, polythene and plastic under the Company’s Go Green project. Colour coded bins are provided in dining areas to segregate food from wrapping material, as waste food is given to a third party for use as animal feed(specially designed vehicles are provide by the Dimo until destination of disposal). As local authorities are not fully geared to handle waste disposal in this manner, we have found our own solution.
During the last year the Company has operated an MOU with Central Environmental Authority –accredited third party Holcim Geocycle to provide a waste management solution for our hazardous and non-hazardous waste.
Dimo is working towards a paperless office environment. We are looking to reduce paper usage and wastage at every opportunity. Some of our initiatives include an e-mail rider campaign discouraging printing copies of e-mails unnecessarily, use of recyclable paper bags at our sales outlets, maximising use of paper (both sides as opposed to one-side used and dumped) and recycling printer cartridges.
| Type of Paper Consumed | Quantity consumed (KG) | Consumption per average number of employee | ||||
| 2012/13 | 2011/12 | 2010/11 | 2012/13 | 2011/12 | 2010/11 | |
| A4 | 9,115.7 | 16,698 | 14,126 | 5.99 | 14.16 | 15.00 |
All waste paper is sent to an accredited recycler. An estimate of resources saved as a result is given below.
| Description of Saving | Measure-ment | 2012/13 | 2011/12 | 2010/11 |
| Quantity of paper handed over (KG) | 4,795 | 621 | 1007 | |
| Tree | Nos. | 82 | 10 | 17 |
| Water | Lts. | 8,415 | 1,090 | 32,002 |
| Oil | Lts. | 19,180 | 2,484 | 1,767 |
| Electricity | kWh | 152,385 | 19,735 | 4,028 |
| Land Fill | M | 14 | 1.9 | 3 |
Non-hazardous Solid waste disposal
| Waste Category | Quantity, Kg | Method of Disposal | ||
| 2012/13 | 2011/12 | 2010/11 | ||
| Organic | 34,417 | 48,033 | 31,210 | To third party as animal feed |
| Paper – A4 | 4,795 | 621 | 4,719 | To third party for recycling |
| Contaminated paper | 6788 | 5,390 | ||
| Cardboard boxes | 20,227 | 2,576 | ||
| Polythene | 3,388 | 2,577 | 987 | To third party for recycling |
| Plastic | 1,337 | 1,062 | 1,043 | Collected as garbage by Local Authority |
| Pallet racks | 63,854 | 5,730 | - | To third party for recycling |
Organic waste generation/disposal has reduced during the year in the wake of awareness campaigns conducted to reduce food waste.
The quantity of A4 sized paper disposed has increased as the collection mechanism was streamlined and introduced at all locations.
Waste consisting of cardboard boxes and pallet racks has increased due to an increase in goods shipped to the Group.
Hazardous Waste Management
Chemical spillages are virtual non-existent at Dimo. Should they happen, there is a well documented set of rules and guidelines in place with which our staff are familiar, in order that quick and correct response could be affected. Equipment such as oil suckers is available to deal with spillages. Waste is handed over to relevant third parties for recycling.
Employees are regularly trained on safe practise and the proper handling of material. Suitable equipment is in place in the event of an accident, such as oil suckers to clean up spillage.
Hazardous Waste Disposal
| Type of Waste | Units | Quantity Disposed | Current Method of Disposal | ||
| 2012/13 | 2011/12 | 2010/11 | |||
| Waste oil* | Litre | 131,803 | 104,762 | 56,798 | Handed over to authorized third party for recycling |
| Thinner | Litre | 614 | 1,243 | 440 | |
| Sludge | Kg | 70,723 | 57,454 | 56,859 | |
| Metal scrap | Kg | 32,376 | 34,605 | 21,101 | |
| Metal dust | Kg | 2,260 | 2,189 | 2,335 | |
| Paint cans | No. | 1,117 | 933 | 1,664 | |
| Filters | No. | 36,368 | 20,447 | 21,957 | |
| Batteries | No. | 361 | 218 | 93 | |
| Tyres | No. | 337 | 493 | 665 | |
| Saw Dust | Kg | 147.5 | 19 | - | |
* Waste oil includes – engine oil from serviced vehicles and kerosene oil (small type)
The increase in level of battery disposal is attributable to the increase of warrant and accident repairs at Matara.
The quantity of disposed waste oil has increased due to the increase in vehicle throughput at the TATA Passenger Workshop and Siyambalape Workshop
The increased level of disposal as regards air filters can be attributable to two main factors. Firstly, in the previous financial year, anomalies in the units of measurement that existed between Colombo and our other locations plus the fact that TATA passenger workshop in Colombo was not included in the measurement, produced inaccuracies. These anomalies have been rectified this year.
Secondly, vehicle throughput has also increased in all locations.
Our TATA and Balagolla workshops did not measure cotton waste disposal during 2011/12. During the year under review, all locations have done so and are reporting on same, whilst the increase in vehicle throughput has resulted in the increase consumption of cotton waste.
No spillage has been reported for the period in review.
No water has been discharged to any water bodies during the period in review.
Materials Management
Materials Usage
The chart below gives details of the main materials used by the Dimo Group
| Type of Material used | Type | Measurement | Quantity | ||
| 2012/13 | 2011/12 | 2010/2011 | |||
| Paints | Non- Renewable | Lt | 7,563 | 2,281 | 16,927 |
| Kerosene | Non- Renewable | Lt | 41,228 | 48,619 | 25,667 |
| Lubricants * | Non- Renewable | Lt | 253,073 | 209,769 | 85,589 |
| no. of tyres retreaded | Renewable | no.s | 1312 | 1,444 | 4,865 |
| Floor Carpets | Renewable | Nos. | 47,500 | 45,200 | 37,000 |
| Cotton Waste | Renewable | Kg | 29,625 | 18,000 | 130,463 |
| Lacquer | Non- Renewable | Lt | 471 | 452 | - |
| Thinner | Non- Renewable | Lt | 19,050 | 7,492 | - |
| Putty | Non- Renewable | g | 331,239 | 142,632 | - |
| filler | Non- Renewable | Lt | 1,016 | 191 | - |
Paint and putty consumption has increased due to the increase of accident repairs affected at our workshops.
Lubricant consumption has increased due to the increase in throughput of TATA vehicles at all workshops.
Dimo prefers to recycle and reuse:
Noise Management
Noise emission from Dimo Group’s activities is strictly controlled. Noise levels are systematically measured by a Central Environmental Authority approved third party and they have been found to be well below stipulated tolerance levels.
Biodiversity
Dimo’s facilities are mostly located in industrial and urban areas and thus are not in any habitat requiring special protection. Thus endangerment of the biodiversity of the country is not impacted by our operations and is therefore not a significant issue.
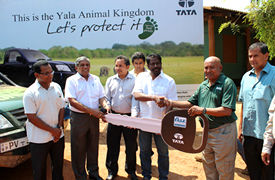
Our Voluntary initiative project for protecting biodiversity
Dimo donates a brand new TATA Xenon for the preservation of Yala National Park
The Company donated a low emission, low noise 4WD high performance TATA Xenon for the purpose of law enforcement and visitor management activities in order to reduce the negative impacts on the flora, fauna and wildlife of the Park. This is the first time a project of this calibre has been encted by the private sector for Yala National Park.
In addition uniforms and headgear were also provided for the Park’s Security personnel and drivers. A brochure will be presented to every visitor providing important information as well as a list of “Do’s and Don’ts” at the Park.
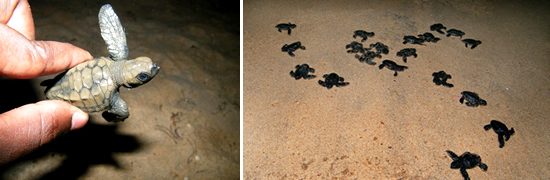
Turtle Conservation Project by DIMO Nature Club
Dimo together with the Environment Foundation (Guarantee) Ltd. (EFL) and Wildlife Research & Conservation Trust (WRCT) currently carries out a Turtle Conservation Project in the 4km stretch of Komari and Panama (Arugam-Bay) areas.
The project was initiated on the 1st December 2012 with the financial support of Diesel & Motor Engineering PLC.
The initiative consists of a nest protection programme where regular beach patrols seek to protect precious nesting grounds of some of the world’s most precious species of turtles – the Olive Ridley (Lepidochelys Olivacea) and Hawksbill (Eretmochelys Imbricata). The largest turtle species in the world, the Leatherback (Dermochelys Coriacea) has also visited the study area twice without nesting.
During this period volunteers of the DIMO Nature Club participated in the programme to support the research team at the site.
A total number of 104 nests have been protected as of now. Approximately 11,000 eggs have been protected since the beginning of the project. So far 4,245 hatchlings have made their way to the sea and more than 89% of the eggs have successfully hatched.
Transportation
Key environmental impacts in this area arise from emissions from fuel combustion, noise, waste and spillage or leaks. Fuel consumption and atmospheric emissions of all our vehicles or those controlled by us are strictly monitored. Whilst these aspects are important areas in the context of the operations of our EMS, we still take them into account when choosing our logistics partners.
Compliance
Dimo has not been fined or penalised for non-compliance with any legislation pertaining to environmental or social safeguards during the year in review. All statutory requirements are regularly monitored and have been complied with.
Environmental Expenditure
Expenses incurred in respect of our water treatment and recycling plants amounted to Rs. 8.41 mn for the year in review (Rs. 3.06 mn in 2011/12).